
Information Design
Ai
Ps
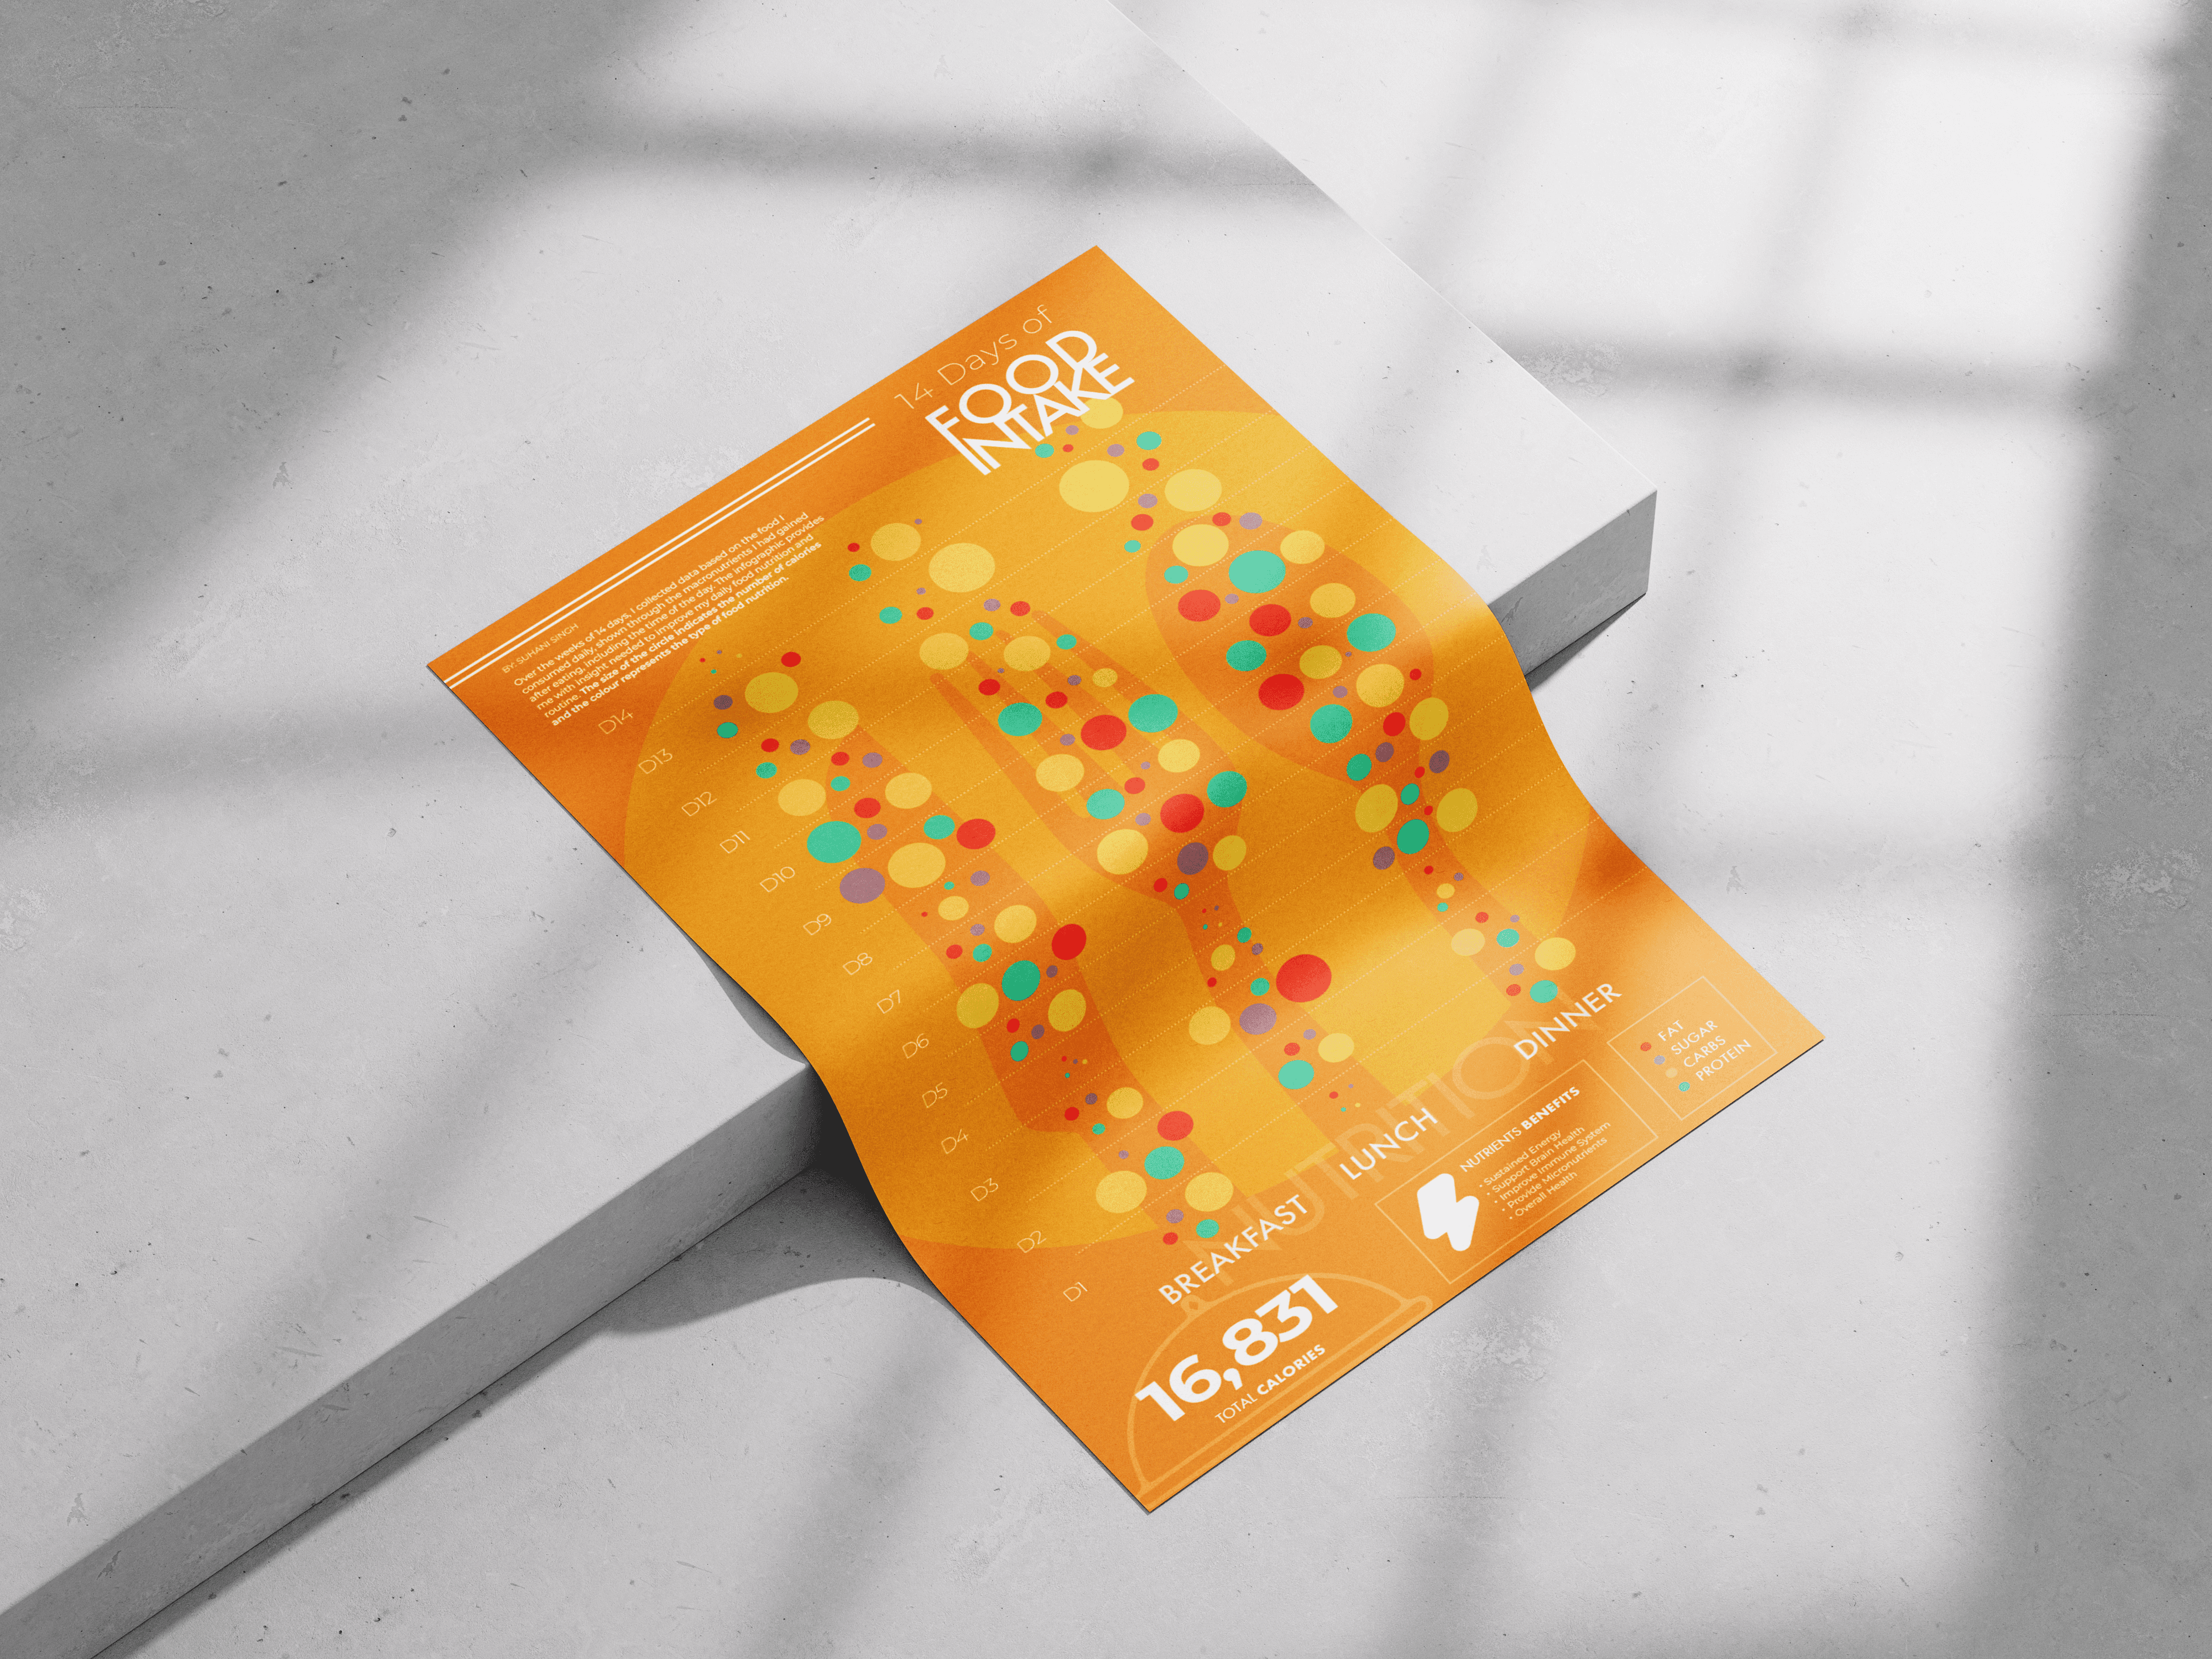
Food Intake
OBJECTIVE
Collect daily data on a topic for 14 days and create an informative and visually engaging inforgraphic. The design should clearly communicate patterns, changes or insights from the data,using visual storytelling and graphical elements to make the information accessible and captivating.
solution
The infographic displays daily food intake over 14 days, showing macronutrients and meal times. Circle size indicates calories, while colours represent different nutrient types. A cutlery overlay organizes the data into a clear visual hierarchy, maintaining a minimalist design while incorporating vibrant colours and sleek typography. This balanced structure makes complex data accessible, engaging and easy to interpret.
